

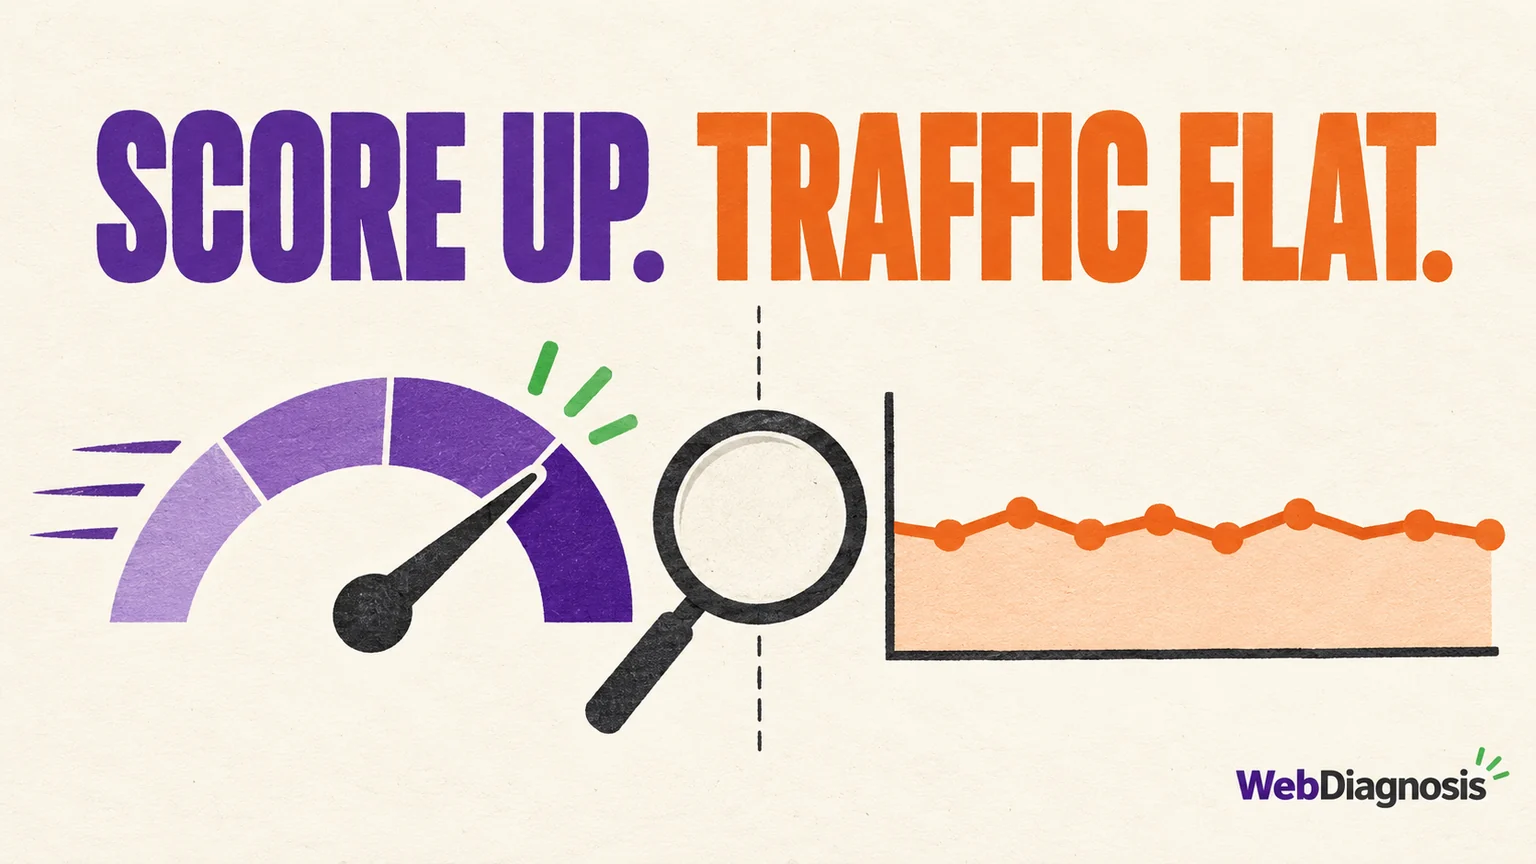
A better PageSpeed score does not automatically create more traffic. It may prove that one simulated test ran faster. It does not prove that real visitors experienced the same improvement, that Google has enough fresh field data to recognise it, or that speed was the problem holding the page back.
Start by identifying what actually improved. Then check whether impressions, rankings, clicks or conversions moved. Those are different outcomes, and each points to a different next step.
| What you are looking at | What it tells you | What it does not prove |
|---|---|---|
| Lighthouse performance score | How the page performed in a controlled lab simulation | How most real visitors experienced the page |
| PageSpeed Insights field data | How eligible Chrome users experienced the URL or origin over a rolling 28-day period | That rankings or search demand improved |
| Search Console Performance | Whether Google Search impressions, positions, CTR and clicks changed | Whether all traffic sources or conversions improved |
| Analytics and business outcomes | Whether visits, engagement, leads or sales changed | That speed alone caused the change |
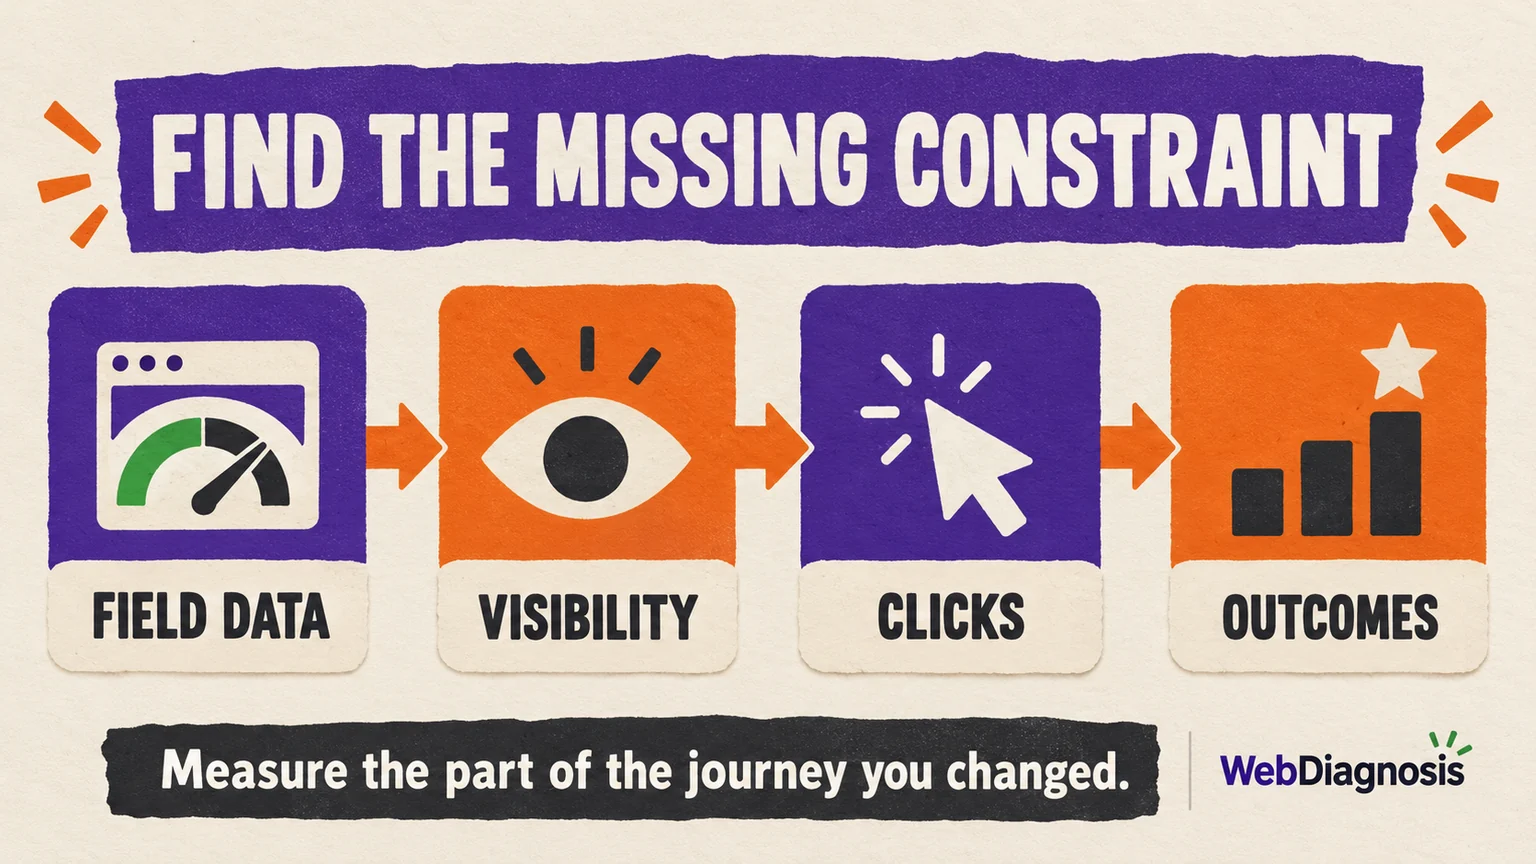
PageSpeed is a useful stopwatch. It is not a marketing department.
First, check whether the improvement was lab data or field data
The large performance number at the top of a Lighthouse report is lab data. Google runs the page under controlled device and network conditions, scores that single run, and uses it to expose technical opportunities. It is valuable for debugging, but Google says lab data may not capture real-world bottlenecks.
The Core Web Vitals assessment in PageSpeed Insights uses field data from the Chrome User Experience Report. It reflects eligible real-user visits over the previous 28 days. Mobile and desktop are reported separately, and a low-traffic URL may show origin-level data or no field data at all.
This creates three common situations:
- The lab score improved, but field data did not. The fix may not help real devices and connections, or the field window may still include pre-fix visits.
- Desktop improved, but most search visitors use mobile. Test the page and review Search Console by device instead of averaging two different experiences.
- The tested page improved, but the affected landing pages did not. A fast homepage cannot repair a slow article, category or service template that receives the impressions.
Compare the same URL, device type and date range. Look at Largest Contentful Paint, Interaction to Next Paint and Cumulative Layout Shift, not only the combined score. Google and web.dev both recommend using field data to understand real users, then using lab tools to diagnose and test fixes. The two datasets can differ because they represent different devices, networks and time periods, as explained in web.dev’s lab and field data guide.
Next, find where the traffic chain stopped
Organic traffic is the end of a chain: Google must index the page, show it for relevant searches, rank it where people notice it, earn the click, and send the visitor. A speed improvement affects page experience. It does not create search demand, rewrite an unclear result or make an off-target page more relevant.
Open Search Console’s Performance report and compare a meaningful period before and after the change. Filter the exact landing page first, then review its queries and split the data by device. Google’s Performance report documentation explains how to compare clicks, impressions, CTR and position by page, query, country and device. If impressions are rising while clicks stay flat, use the query-by-query diagnosis before blaming speed.
| What changed after the speed work? | What it suggests | What to investigate next |
|---|---|---|
| Impressions and position stayed flat | Speed was probably not the main visibility constraint | Indexing, query intent, content usefulness, competition and authority |
| Position improved, but impressions stayed flat | The page may target a small or declining search market | Query demand, seasonality and whether the page covers the right problem |
| Impressions rose, but CTR fell | More visibility did not turn into proportionate clicks | Query relevance, title, snippet and the current search results |
| Clicks rose, but total traffic looked unchanged | Organic gains may be hidden by a decline in another channel | Analytics acquisition reports and channel-level dates |
| Traffic stayed flat, but conversions improved | The speed work may have improved the visit rather than acquisition | Lead rate, sales, engagement and mobile completion paths |
Do not compare only site-wide totals. A meaningful improvement on five commercial pages can disappear inside a large blog’s overall graph. Conversely, a homepage score can jump while the pages earning search traffic remain unchanged.
Why a faster page can still rank in the same place
Google includes Core Web Vitals in its ranking systems, but it also says there is no single page-experience signal and that good scores do not guarantee top rankings. Relevant, useful content still matters more than polishing a score for its own sake. Google’s own page experience guidance warns that chasing a perfect score solely for SEO may not be the best use of time.
If real-user performance now passes but rankings remain flat, inspect the constraints speed cannot solve:
- The page answers a different question. A fast result that misses the searcher’s decision is still the wrong result.
- The useful answer arrives too late. Removing 300 milliseconds will not rescue an introduction that makes readers dig through five paragraphs for the point.
- The page is not indexed or Google prefers another URL. Check URL Inspection, canonicals and overlapping pages.
- The result earns impressions but few clicks. Compare the title and snippet with what the current results promise. Do not change them blindly if the page already attracts qualified clicks.
- Competitors provide stronger evidence or a better format. Speed cannot replace original data, clear demonstrations, credible experience or a result that fits the intent.
- Nobody is searching more often. Better performance can improve the experience of existing demand, but it cannot manufacture additional searches.
Decide whether more speed work is still the best next move
Continue when field data shows real users still face poor loading, responsiveness or layout stability on valuable pages. Also continue when analytics shows a clear device-specific leak that matches the performance problem. Fix the underlying experience, validate it in the lab, then watch the field data catch up.
Stop polishing when the remaining work targets a perfect Lighthouse score but users already receive a fast, stable experience and another constraint has stronger evidence. A green 100 is a pleasant report card, not a traffic delivery receipt.
That distinction affected the priorities in the documented WebDiagnosis site review. The research page transferred about 15 KB, decoded to about 55 KB and reached DOM interactive at 581 milliseconds in the audit environment. Those measurements did not prove perfect Core Web Vitals, but they also did not reveal a performance emergency. Active site-wide problems such as stale HTML caching, missing canonicals and conflicting structured data had clearer evidence and broader consequences, so they came first. The checks and evidence boundaries are documented in the site’s publishing methodology.
The practical rule is simple: use PageSpeed Insights to diagnose performance, field data to verify real-user improvement, Search Console to measure search visibility, and analytics to judge visits and outcomes. If the PageSpeed score improved but traffic did not, do not undo a useful speed fix. Find the next constraint with the evidence that measures it.